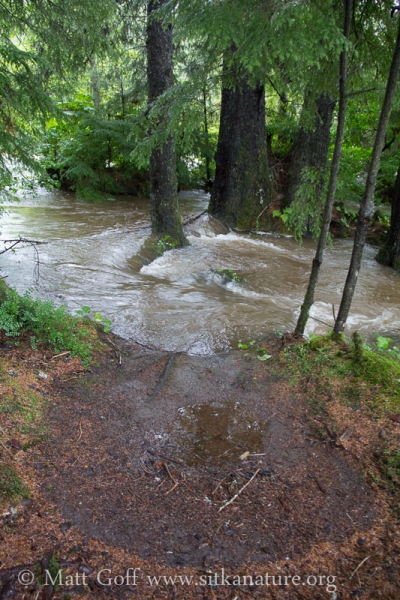
Another 2+ inches of rain fall yesterday, raising water levels again. After learning about the Indian River stream gauge page, I tracked it throughout the day to help decide when I would go check out the water levels at Indian River. I ended up heading down there a bit after 4pm, and it was clear from what I saw the water levels had dropped a few inches already. As you can see from the plot below, the gauge had the crest at just over 25ft around 3pm, with a small drop over the next hour, and relatively rapid decrease after that. I’m not sure what the measurement actually refers to, but it’s certainly not the water depth. Poking around on-line, it appears that gauges are set to have 0 be a (potentially arbitrary) known elevation. My guess in this case is that it’s the 0ft tide elevation.

Current observations of Indian River gauge.
While the water levels were definitely much higher than normal, they still were not unusually high. I’m pretty sure they were higher last week (though unfortunately the data on the page only goes back a couple of days, and I’ve so far not found a data archive). The historical crests (I think this gauge may have been installed last summer) are given as 26.32 ft (last November) and 25.78 ft (in January). In any case, the highest I’ve seen the river was probably at least 3 feet higher than this crest, and there have been several times I’ve seen it over a foot higher than this. Over this coming fall and winter, it will be interesting to get a better feel for what the various measured heights look like on the river.
You can see the depression where the water had been earlier in the day by the ring of spruce needles surrounding the nearly bare soil.
Questions
- What is the highest Indian River has flooded in the past 100 years?
- How correlated is the river height with amount of rain at the airport?
- Is historical data from this (and prior) stream gauges available somewhere?

